
Menu

What do 40 years of ABCD look like in data? This page gathers interactive visualizations of the journal's scientific reach and of the community behind it. Every chart is live: hover, drag, zoom and click to explore.
The counter below shows the total number of times ABCD articles have been cited by other scientific publications (source: Web of Science) — a direct measure of the journal's influence on the field.
ABCD has become a platform for international research: each red arc links Brazil to a country whose researchers co-authored multicenter or collaborative studies published in the journal — more than 20 countries across the Americas, Europe, Asia and Africa. Drag the globe to spin it; the side list ranks the strongest partnerships.
How to read this map: each circle is one of the most productive ABCD authors; the size of the circle reflects how many articles that author published in the journal; colors group researchers who frequently publish together (research communities); and each line is at least one co-authored paper. Scroll to zoom, drag to move, and hover a name for details (data: Dimensions).
Interactive VOSviewer map — data from Dimensions. View the live version on Dimensions ↗
The most frequent keywords across ABCD articles — the bigger the word, the more studies on that topic. Together they draw the map of the journal's territory: bariatric surgery, obesity and laparoscopy lead the field.
Eight quick questions on study design and research methodology, based on the guides from our Writing Hub. Answer each one and get instant feedback — can you score 8 out of 8?
Conversations on digestive surgery and scientific publishing. Videos open right here on this page.
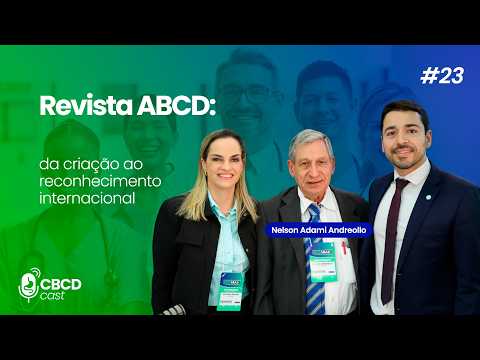 ▶Revista ABCD: from creation to international recognition▶ Watch (Prof. Nelson Adami Andreollo)
 ▶Scientific production in medicine: errors and strategies▶ Watch (Prof. Francisco Tustumi)



Desenvolvido por Surya MKT